Cause And Root Cause

1.0 PURPOSE:
This procedure describes the structured approach and methodology to conduct an investigation of any discrepancies in GMP compliance/quality systems with the objective of determining the potential root cause, impact/risk assessment, and appropriate corrective and preventive action to avoid reoccurrence.
2.0 SCOPE:
Applicable to the investigation of
1. Deviations
2. Non-conforming Products
3. Market Complaints
4. Product Recalls
5. Self-Inspection observations
6. Product Quality Reviews
7. Internal Data Reviews
8. Validation results
9. Inspectional Findings
10. Out-of-Specification Test Results
11. OOS result at Contract testing lab
12. Lab Deviations
13. Out-of-trend results in manufacturing and testing activities.
14. Independent investigations and investigation of any other product quality issue etc.
3.0 RESPONSIBILITY:
All Departmental Heads
4.0 DEFINITIONS:
4.1 Investigation: A simple systematic process for finding the underlying harmful, factor (cause) of a discrepancy failure, impact assessment, and appropriate corrective and preventive action.
4.2 CAPA (Corrective and Preventive Action): A systematic approach that includes actions needed OR Corrections (correction), prevents recurrence (corrective action), and eliminates the cause of potential (preventive action), non-conforming product, and other quality problems.
4.3 Discrepancy: Datum of result outside of the expected range, an unfulfilled requirement may be called non-conformity, defect, deviation, out-of-specification, out-of-trend, etc.
5.0 PROCEDURE:
The key to a successful investigation is to record every inquiry, every question, every doubt, and every suspicion as probable reasons and get an answer to the same. The answer should always be supported with a valid document used to record the event supporting the investigation and can be considered as evidence. A hypothesis to figure out the underlying reason for such an event may be derived to demonstrate the sequence of events resulting in the discrepancy. Investigations can also be triggered by any of the investigators based on suspicious or a lead/information from any individual on a quality-related issue. An issue/event/activity / visual can be brought under the scope of investigation if found to be suspicious with a potential to harm the quality of the product.
5.1 Selection of Investigation Team Members:
5.1.1 An investigation team shall be formed based on the issue to be discussed and investigated. The team members may be added as the investigation progresses or as needed.
5.1.2 The investigation team shall include members from the originating departments and the relevant area of activity to begin with.
5.1.3 Investigation team member shall be formed based on their experience, skills, area of expertise, etc.
5.1.4 This list shall be prepared by the originating department Head and approved by the Head of Site Quality Assurance.
5.2 Investigation Methodology:
5.2.1 Investigation includes the following steps
1. Step I-Initiation of investigation
2. Step II-Collection of Data
3. Step III-Identification of possible factor (Root cause analysis)
4. Step IV-Summary of Investigation
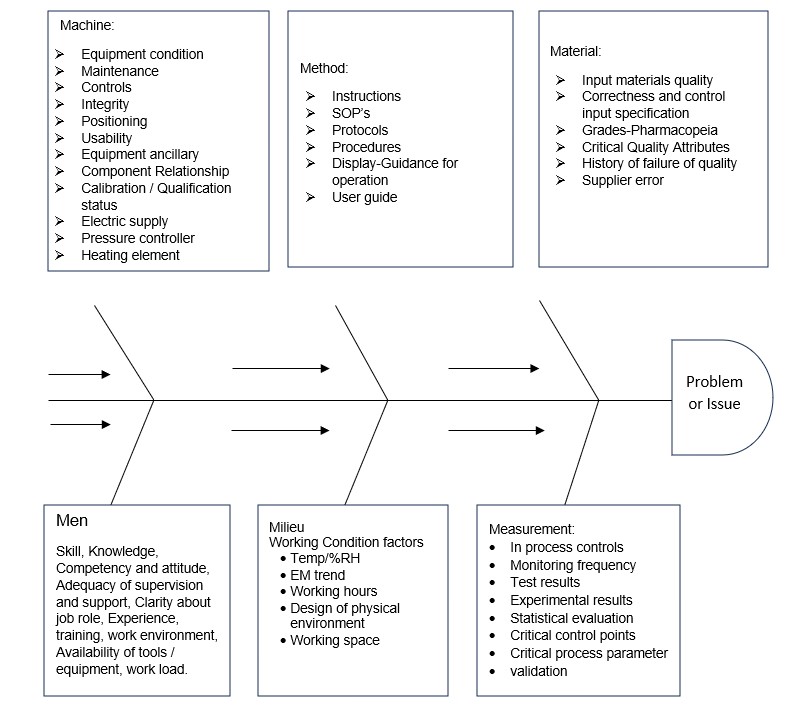
A) Fishbone or Ishikawa or Cause-and-Effect Diagrams:
Ishikawa diagrams are also called Fishbone Diagrams, Cause and Effect Diagrams. The various possible causes are grouped into categories such as Men, Machines, Methods, Milieu (environment), Materials, and Measurements and the arrows indicate how the cause cascades or flows towards non-conformity. The identified causes shall be discussed in detail to demonstrate the potentiality of not causing the failure by stepwise elimination process. The example given below is for guidance purposes, investigation team members may review additional parameters as per discrepancy.
Whys: The investigator shall keep asking the question ’Why?’ for the non-conformance/suspect until the contributing factor underlying the problem can be identified.
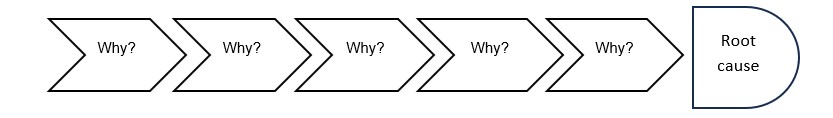
Benefits of 5-Why:
1. Simplicity: It is to use and requires no advanced mathematics or tool.
2. Flexibility: it works well alone and when combined with other quality improvement and troubleshooting techniques.
3. Quick resolve: It helps to quickly separate symptoms from causes and identify the root cause of a problem.
Brainstorming is a group or individual creativity by which efforts are made to find a conclusion for a specific problem by gathering a list of ideas spontaneously contributed by team members. Brainstorming technique is considered to be more effective than individual working alone in gathering ideas. Possible target questions to serve as the focal point of the brainstorming process.
The team member meets and puts all the facts on the table, saying, “This is what we know," while continuing to look for any other potential root causes. While brainstorming represents a kind of free-for-all of ideas, it can and must be done in a structured way. Don’t dismiss anyone’s ideas during brainstorming. Indeed, the goal remains to capture every possible idea, not challenge them individually. A team should refrain from making judgments during this process, given that it has not evaluated any data nor applied any problem-solving tools. Team members shall list dawn all probable causes/hypotheses. The assumptions/hypothesis shall be confirmed by consciously incorporating the assumed cause into the verification/testing. If during brainstorming, no assignable cause is observed then team members can use other tools to identify the root cause.
The histogram plots data in a frequency distribution table. What distinguishes the histogram from a check sheet is that its data are grouped into rows so that the identity of individual values is lost. Commonly used to present quality improvement data, histograms work best with small amounts of data that vary considerably. When used in process capability studies, histograms can display specification limits to show what portion of the data does not meet the specifications.
When to Use a Histogram
1. When the data are numerical.
2. When you want to see the shape of the data’s distribution especially when determining whether the output of a process is distributed approximately normally.
3. When analyzing whether a process can meet the customer's requirements.
4. When analyzing what the output from a supplier’s process looks like.
5. When seeing whether a process change has occurred from one time period to another.
6. When determining whether the output of two or more processes is different.
7. When you wish to communicate the distribution of data quickly and easily to others.
Histogram Construction:
1. Collect adequate consecutive data points from a process.
2. Enter your data. organize your data into two adjacent columns on the spreadsheet. Fill the Left-hand column with your input data and the right-hand with your bin numbers.
3. Open the Data Analysis box. Select "Histogram." Once you’re in the Data Analysis dialog box, find Histogram listed amid the other analysis tools. Then, click OK. This will open the Histogram dialog box.
4. Select the input range and the bin range. Click OK to finish. Excel will generate a new workbook with a histogram table.
Histogram Analysis:
1. Understand the process.
2. Identify all sources or errors or variations in the process and select those sources that are required for further analysis based on your current understanding of problems.
3. Collect and analyze the quantitative data and match the findings to the sources identified in the previous step that can actually produce the outcome observed.
A Pareto chart is a bar graph. The lengths of the bars represent frequency or cost (time or money) and are arranged with the longest bars on the left and the shortest to the right. In this way, the chart visually depicts which situations are more significant.
When to Use a Pareto Chart:
When analyzing data about the frequency of problems or causes in a process.
When there are many problems or causes and you want to focus on the most significant.
When analyzing broad causes by looking at their specific components.
When communicating with others about your data.
1. Identify and list the problems — write a list of all the problems that you need to resolve.
2. Identify the root cause problem -for each problem identify its fundamental cause.
3. Score Problems: Now you need to score each problem. Scoring depends upon the sort of problem you are trying to resolve.
4. Group problems together by root cause: Next group problems together by cause. For example, 40 complaints received related to documents, were put in one group.
5. Add up the score for each cause group: Now add up the scores of each cause group. The group with the top score is your highest priority and the lowest score is your lowest priority.
6. Take action: Now need to deal with the cause of the problem.
5.3 Closure of Investigation:
5.3.1 The investigation report shall be concluded and approved within timelines mentioned in individual SOP i.e., Deviation, OOS, OOT, etc.
5.3.2 Implementation of corrective and preventive actions and monitoring of its effectiveness shall be handled by the procedure.
5.3.3 The completed Investigation report shall be enclosed for relevant Non-conformance. For other investigations, separate files shall be maintained by QA.
6.0 REFERENCES:
6.1 Handling of Deviations
6.2 Control and Tracking of Non-Conforming Products
6.3 Handling of Out-of-Specification (OOS) Test Results
6.4 Handling of Market Complaints
6.5 Product Recall for Export Market
7.0 ABBREVIATIONS:
7.1 QA: Quality Assurance
7.2 CAPA: Corrective and Preventive Action
7.3 RCA: Root Cause Analysis
7.4 OOS: Out-of-Specification
Get ready to use editable documents in MS Word Format (Regulatory standard SOPs with Formats,Templates and Annexure) Only Rs-99₹/-
Contact:
Email: contact@likeways.co.in
WhatsApp/Telegram No: 9738137533 (Only for Message)
Note: Kindly note that you will receive the document through email only after the payment has been completed. Please send the screenshot of your payment confirmation via WhatsApp/Telegram. A payment QR code will be provided from our end.